
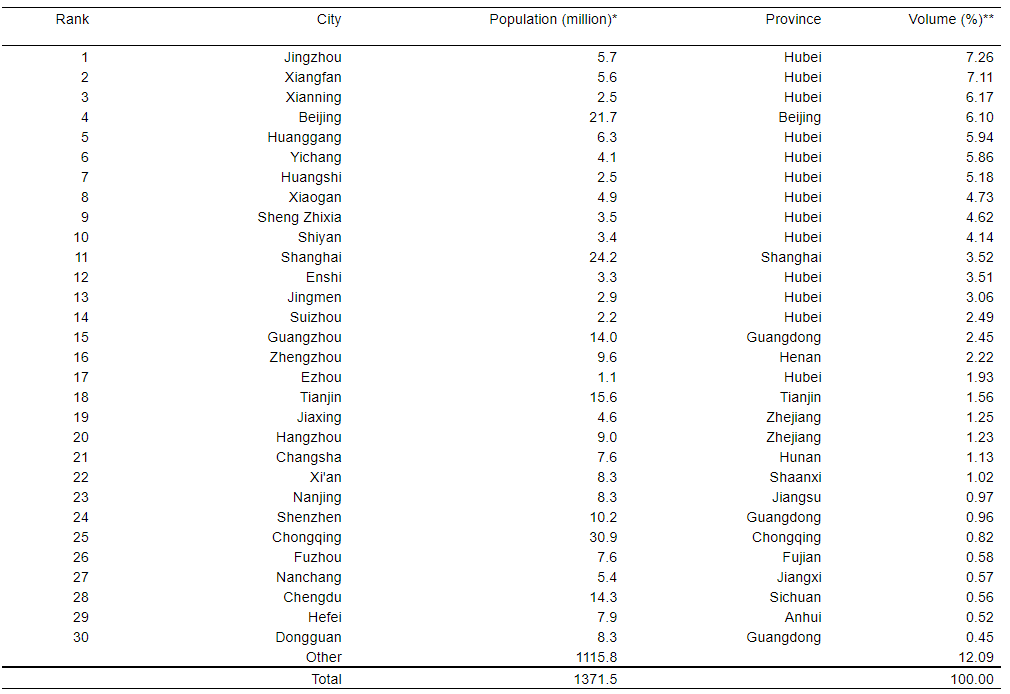
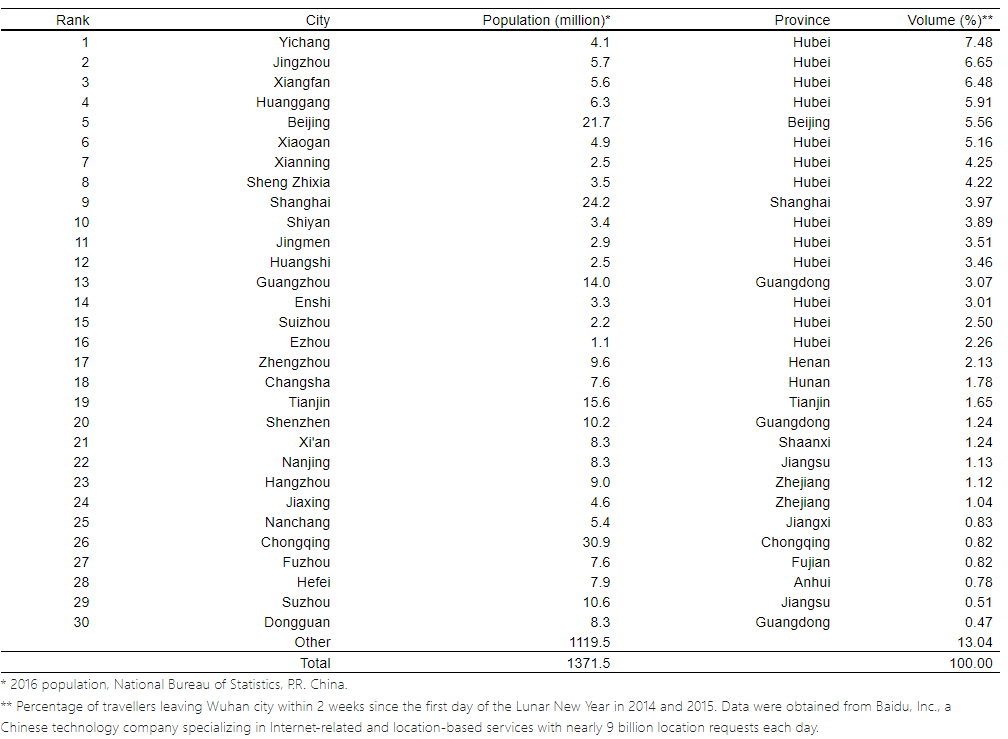
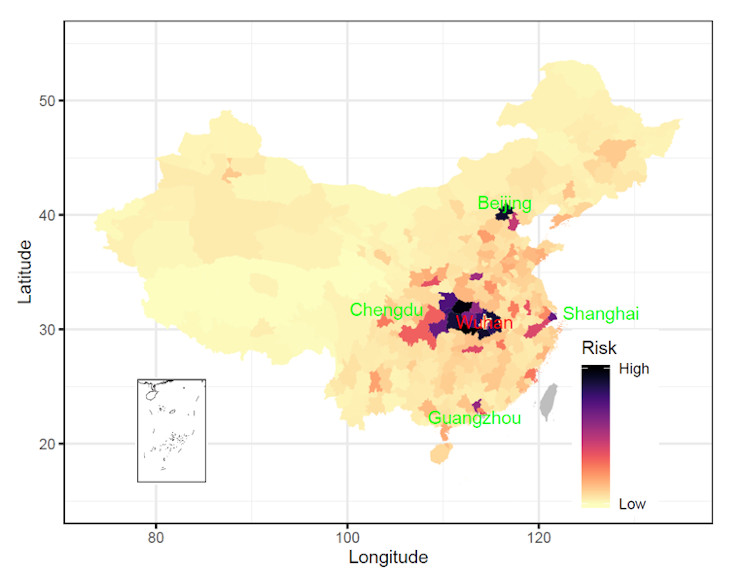
 Figure 2. Risk of cities in mainland China receiving travellers with 2019-nCoV infections from Wuhan during the Lunar New Year migration.
The risk of importation at city level was preliminarily defined as the percentage of travellers received by each city out of the total volume of travellers leaving Wuhan within 2 weeks before and since the first day of Lunar New Year, based on the population movement data from Baidu, Inc.
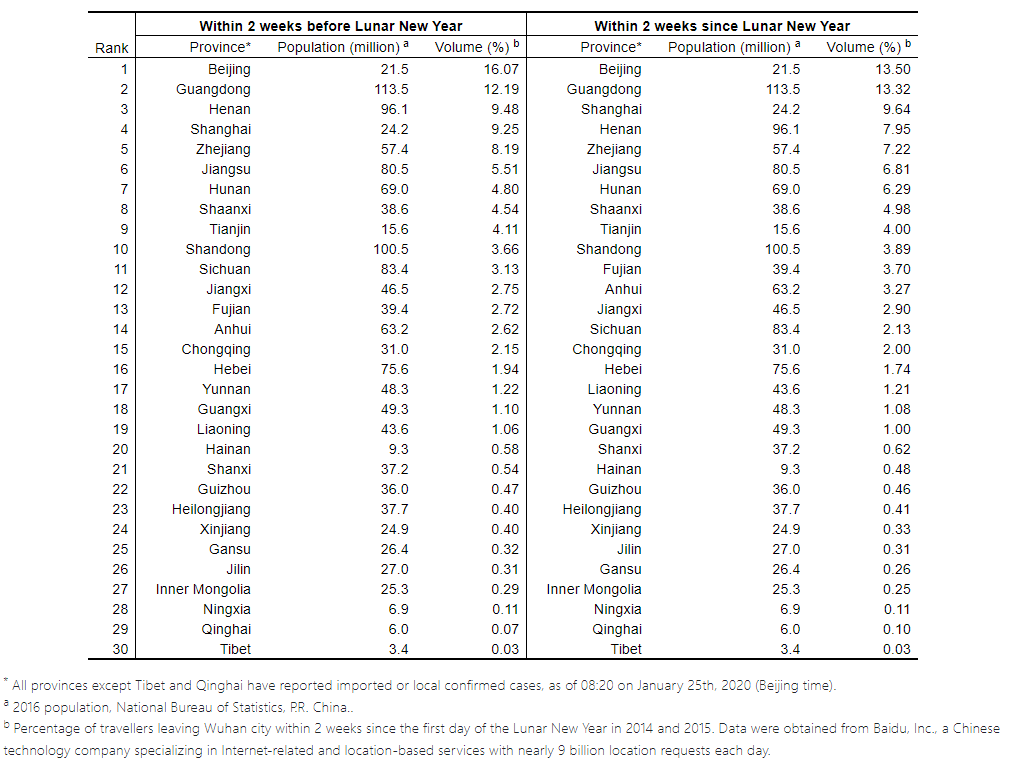
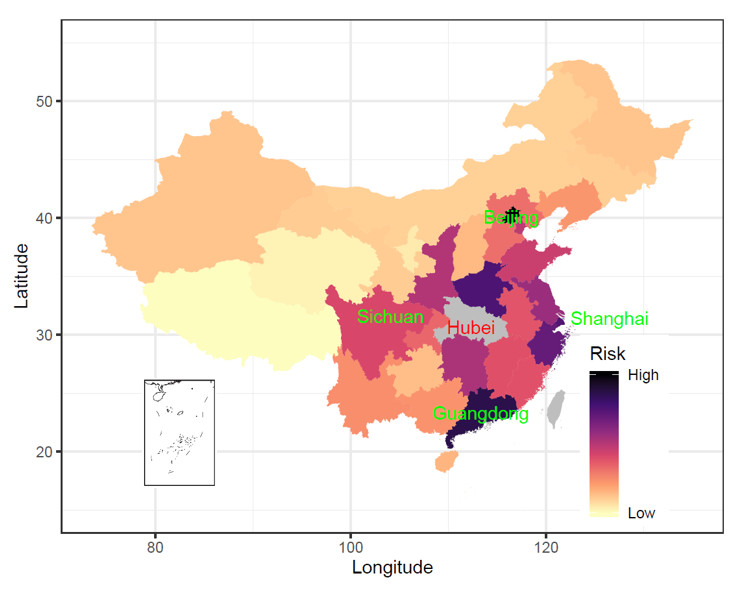 Figure 3. Risk of provinces in mainland China receiving travellers with 2019-nCoV infections from Wuhan during the Lunar New Year migration.
The risk of importation at provincial level was preliminarily defined as the percentage of travellers received by each province out of the total volume of travellers leaving Wuhan within 2 weeks before and since the first day of Lunar New Year, based on the population movement data from Baidu, Inc.
![]() Figure 4. Time distributions of imported cases and correlation between the number of imported cases and the risk of importation via travellers from Wuhan within the two weeks before Lunar New Year’s Day.
Figure 4. Time distributions of imported cases and correlation between the number of imported cases and the risk of importation via travellers from Wuhan within the two weeks before Lunar New Year’s Day.
(A)-(C) The time distribution of imported cases travelling from Wuhan, illness onset, admission to hospital, and diagnosis by province. (D) correlation between the number of imported cases reported in each province and the risk of importation via travellers. The risk of importation at provincial level was preliminarily defined as the percentage of travellers received by each province out of the total volume of travellers leaving Wuhan within 2 weeks before and since the first day of Lunar New Year, based on the population movement data from Baidu, Inc. The data on cases as of January 24thip>, 2020, were obtained from the websites of Chinese National and Local Health Commissions.
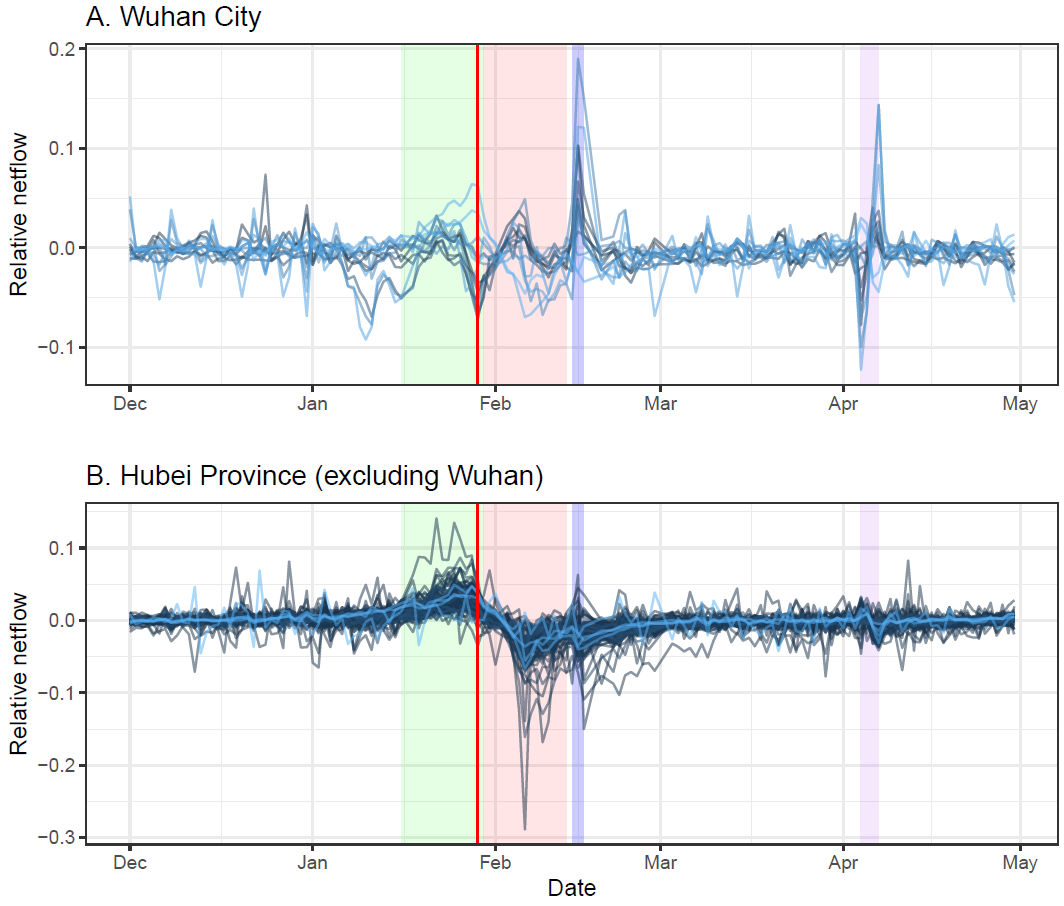
 Figure 5. Patterns of daily human movement by county in Beijing, Shanghai, and Guangdong Province across six months.
Shadow colours:
- Green: 2 weeks before Lunar New Year;
- Red: 2 weeks since Lunar New Year;
- Purple: Lantern Festival;
- Pink: Tomb Sweeping Day;
Relative netflow = (Inflow – Outflow)/population, based on the population movement data in 2013-2014 from Baidu, Inc.
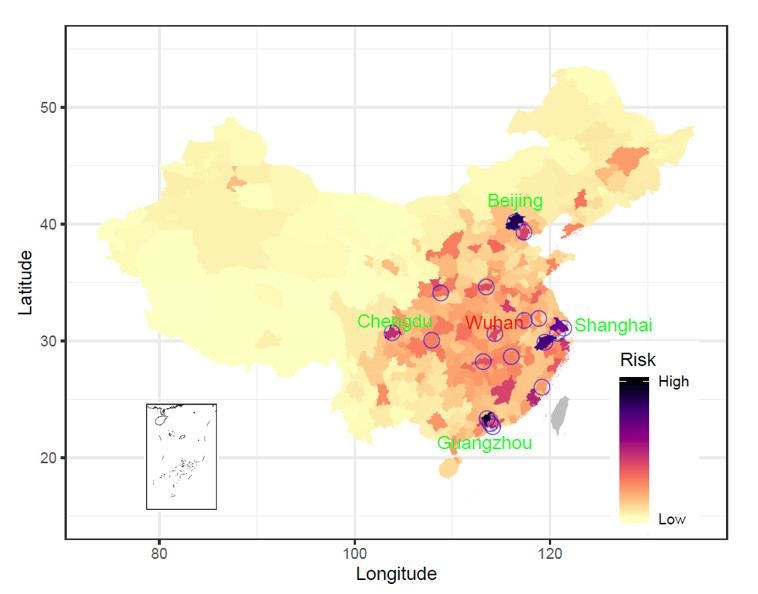 Figure 6. Risk of cities in mainland China receiving travellers from 18 high-risk cities (blue circles) with 2019-nCoV infections or importations during the next four weeks since Lunar New Year’s Day.
The risk of importation at city level was preliminarily defined as the averaged percentage of travellers received by each city out of the total volume of travellers leaving each high-risk city, based on the population movement data from Baidu, Inc.
18 high-risk cities include Wuhan and other 17 cities in other provinces receiving high volume of travellers from Wuhan before the Lunar New Year: Beijing, Shanghai, Guangzhou, Zhengzhou, Tianjin, Hangzhou, Jiaxing, Changsha, Xi’an, Nanjing, Shenzhen, Chongqing, Nanchang, Chengdu, Hefei, Fuzhou, Dongguan.
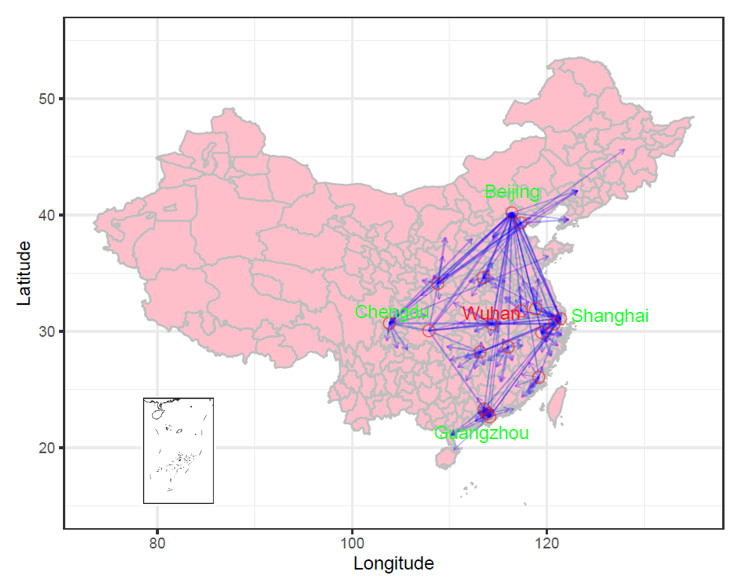 Figure 7. Estimated connectivity of cities in mainland China receiving travellers from 18 high-risk cities (blue circles) with 2019-nCoV infections or importations during the four weeks following Lunar New Year’s Day.
The arrows show the link and direction of the risk of importation at city level, preliminarily defined as the percentage of travellers received by each city (top 10 ranked cities) out of the total volume of travellers leaving each high-risk city (18 cities), based on the population movement data from Baidu, Inc.
18 high-risk cities: Wuhan in Wuhan Province and 17 cities (Beijing, Shanghai, Guangzhou, Zhengzhou, Tianjin, Hangzhou, Jiaxing, Changsha, Xi’an, Nanjing, Shenzhen, Chongqing, Nanchang, Chengdu, Hefei, Fuzhou, Dongguan) in other provinces receiving high volume of travellers from Wuhan before the Lunar New Year.
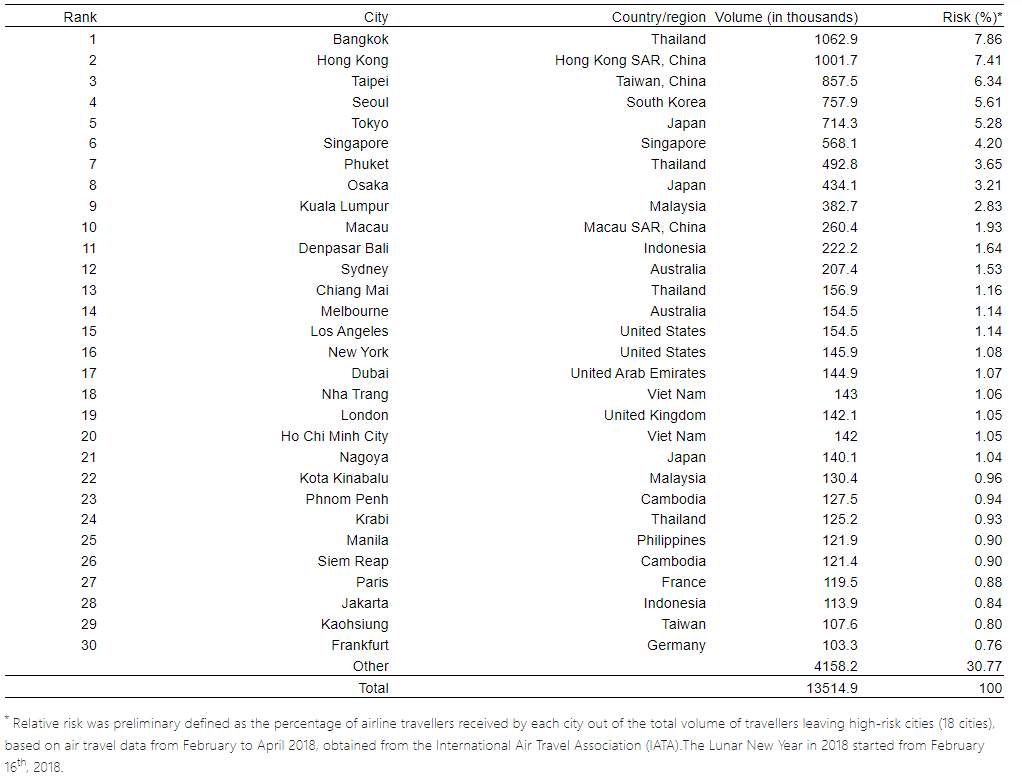
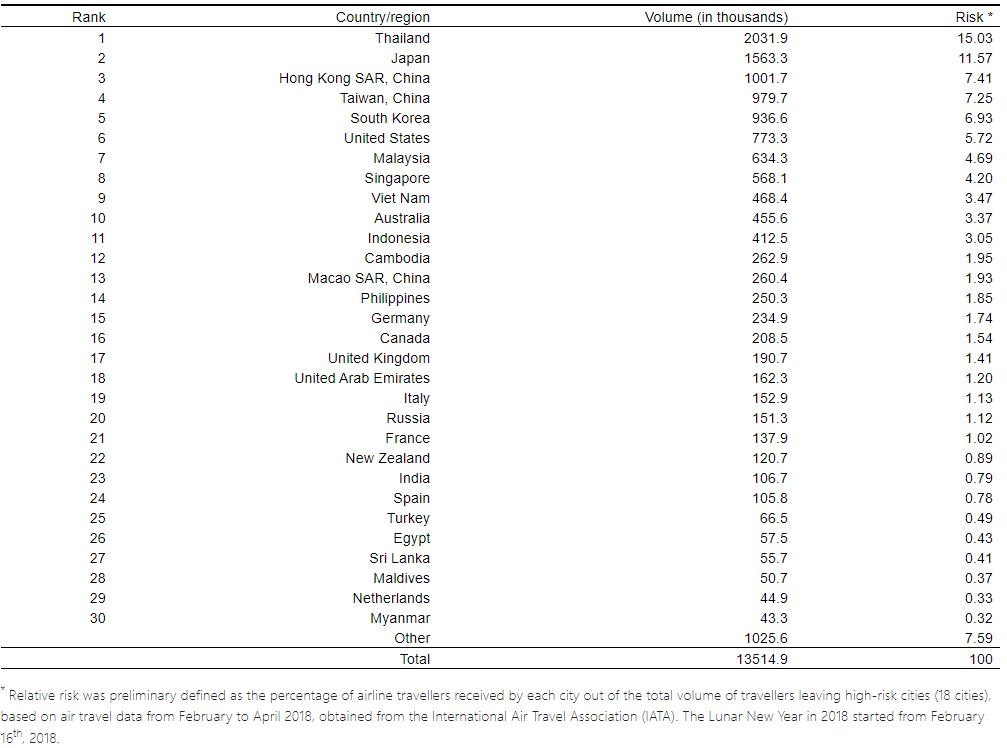
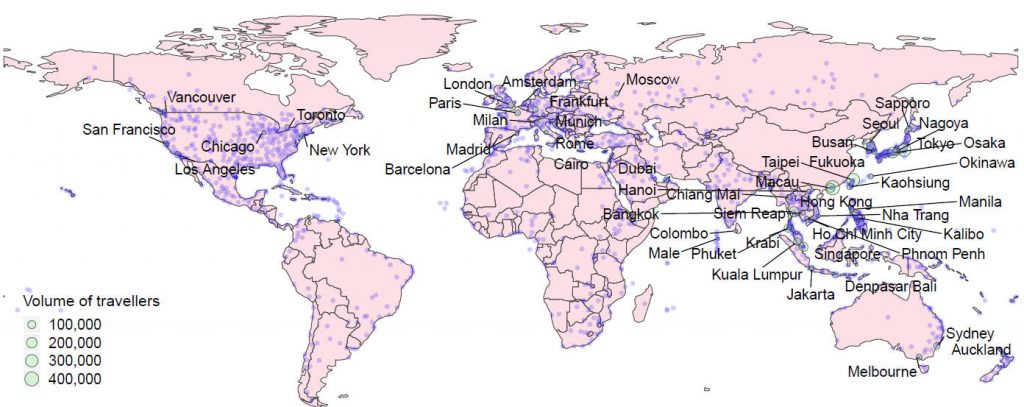
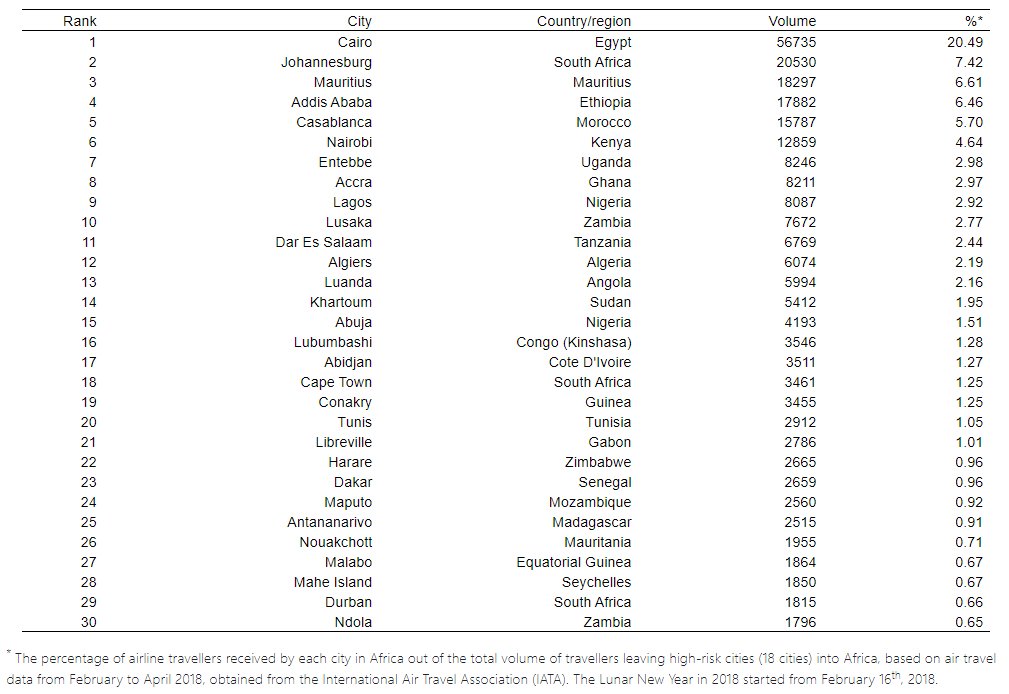
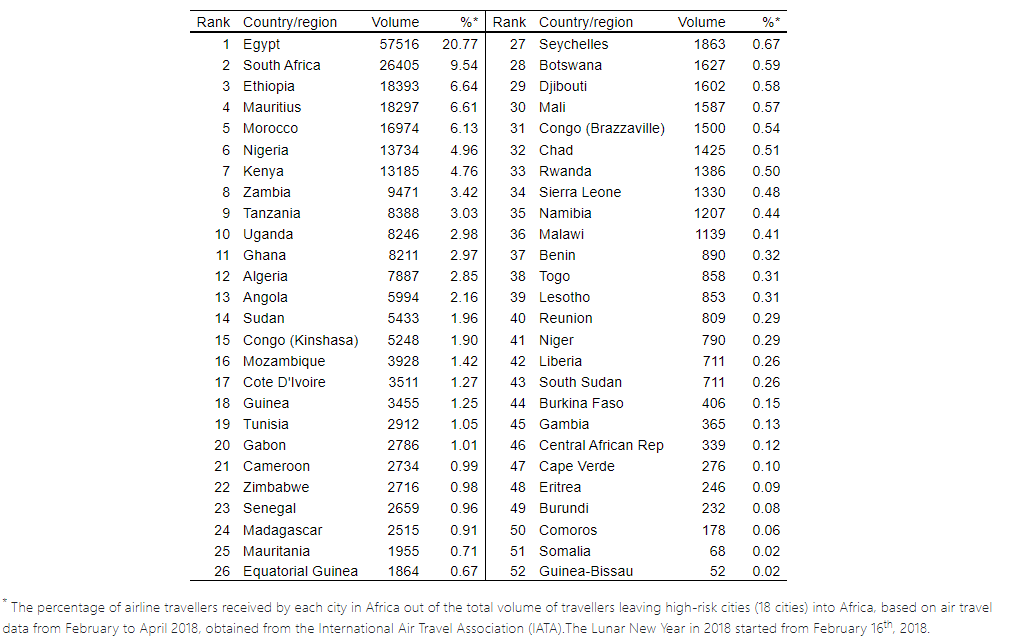
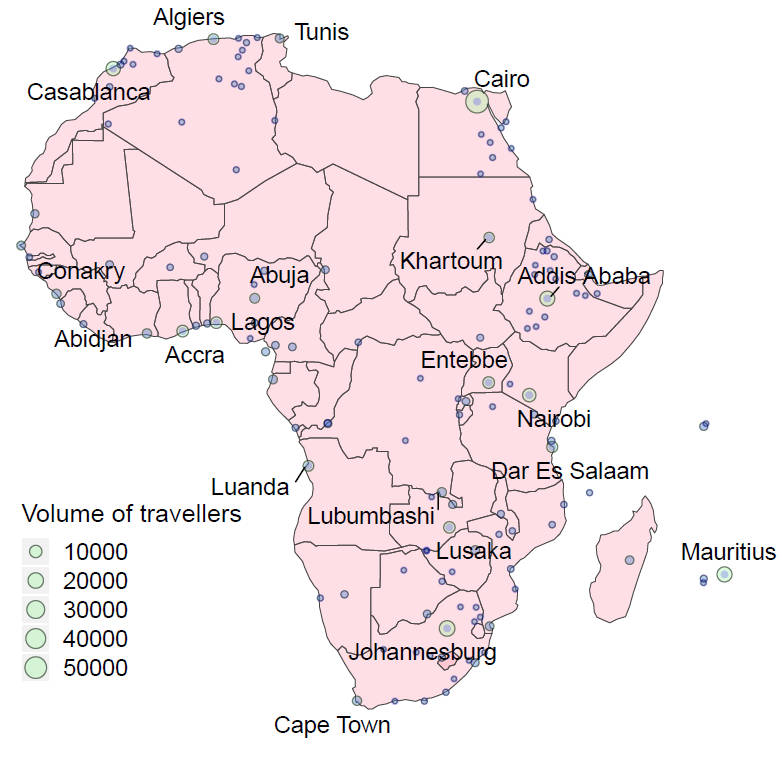 Figure 3. Geographic distribution of African cities receiving airline travellers from 18 high-risk cities (Figure 6) in mainland China over a period of three months, representing 15 days before Lunar New Year’s Day and 2 and half months following Lunar New Year’s Day.
Based on air travel data from February to April 2018, obtained from the International Air Travel Association (IATA). The Lunar New Year in 2018 started from February 16th, 2018.
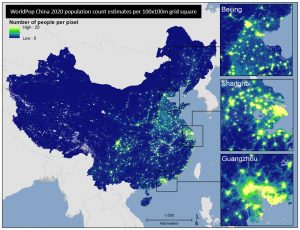 WorldPop China datasets
WorldPop China datasets are available to download here